Powell-Sabin Subdivision
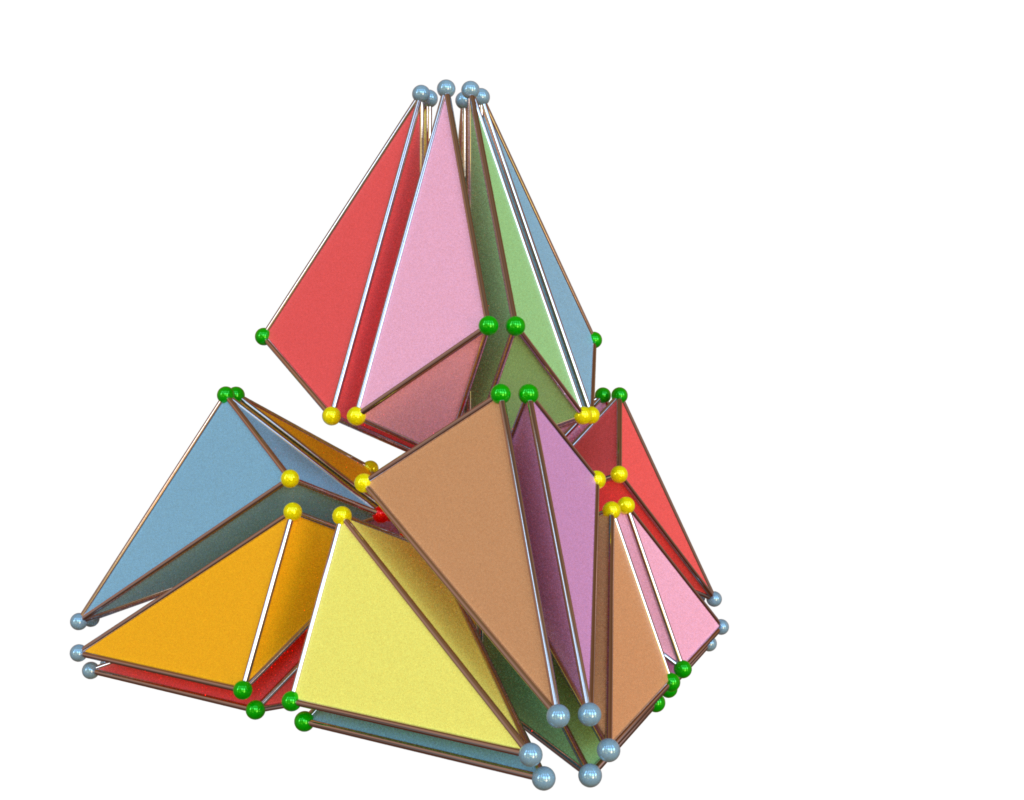
This exmaple visualizes the Powell-Sabin subdivision for tets. A similar figure can be found in Figure 2.1 and 2.2 in the paper "A trivariate Powell-Sabin interpolant".

Data
The data were generated using this script.
Code
#!/usr/bin/env python

import hakowan as hkw

base = hkw.layer("data/powell_sabin.ply").transform(
    hkw.transform.Compute(component="comp_ids", facet_normal="face_normal")
)

vertices = (
    base.mark("Point")
    .channel(size=0.015)
    .material(
        "Principled",
        hkw.texture.ScalarField(
            "vertex_label", colormap=["steelblue", "green", "yellow", "red"]
        ),
        roughness=0,
        metallic=0.3,
    )
)
edges = base.mark("Curve").material("Conductor", "Cr").channel(size=0.005)
surface = base.mark("Surface").material(
    "Principled",
    color=hkw.texture.ScalarField("comp_ids", colormap="set1", categories=True),
)

config = hkw.config()
config.z_up()
config.sensor.location = [2.5, -2.5, 0]
hkw.render(vertices + edges + surface, config, filename="results/powell_sabin.png")

exploded_view = (vertices + edges + surface).transform(
    hkw.transform.Explode("comp_ids", magnitude=0.5)
)
config.sensor.location = [2.5, -2.5, 0]
hkw.render(exploded_view, config, filename="results/powell_sabin_explode.png")